Environment Manager
This page refers to an older version of the product.
View the current version of the User Help.
Analyze Log Files from Disk
This view displays an analysis of the loaded log file. Log entries relating to the same event are collected together.
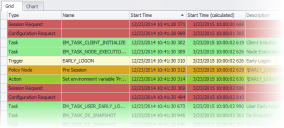
Grid View
The Grid view provides an analysis of activity. Each row is an event, such as an action or condition.
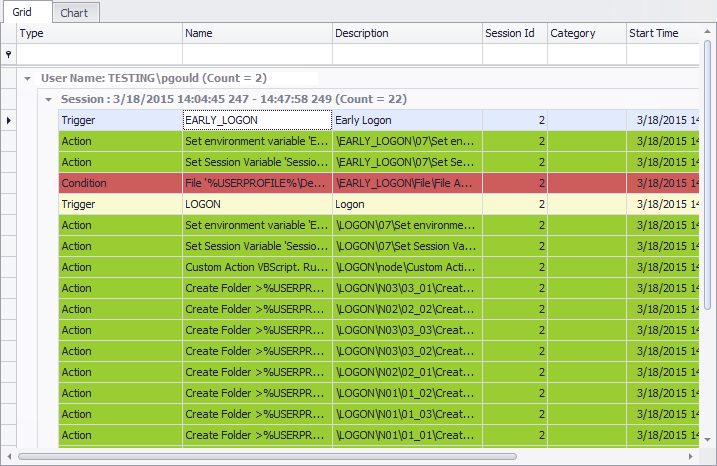
You can sort, filter, group, search, and format the dataset to display the relevant information.
- Right-click a column heading
-
Select Column Chooser.
The Customization dialog displays.
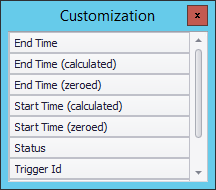
- Drag a column from the Customization dialog into the desired position on the header row.
- Right-click a column heading.
- Select a sort order:
- Sort Ascending - Sort the data in ascending order.
- Sort Descending - Sort the data in descending order.
- To clear the sorting, right-click the column heading and select Clear Sorting.
This option displays all of the unique values for a field, such as all Session IDs, from the open log file. Columns can be filtered by a specific value from the dataset.
-
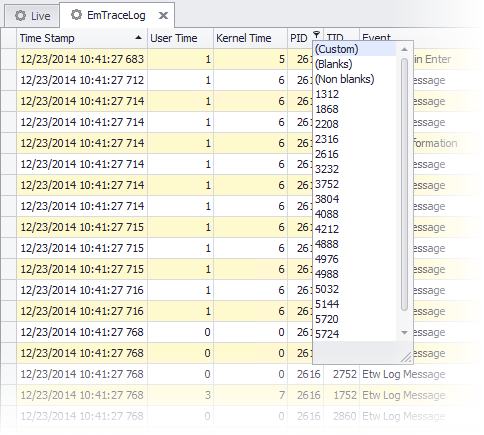
Hover over a column heading and click the filter icon.
A list of unique values within the column displays.
-
Select a value on which to filter the selected column.
The data is filtered to show only entries that match the criteria.
- To clear the filtering, right-click the column heading and select Clear Filter.
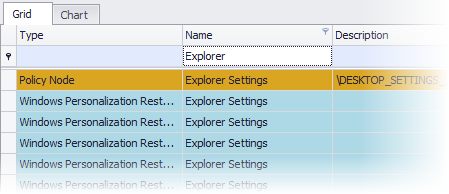
The Auto Filter Row displays above the dataset and allows columns to be filtered by entering basic filtering criteria.
-
Right-click a column heading and select Show > Auto Filter Row.
The Auto Filter Row displays below the column headings.
-
To filter a column, enter text into the Auto Filter Row.
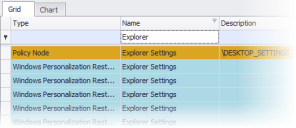
The data is filtered to show only entries that match the criteria entered in the Auto Filter Row.
- To clear the filtering, right-click the column heading and select Clear Filter.
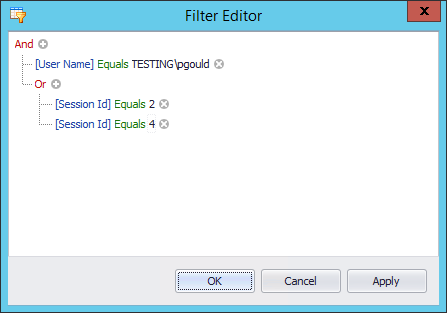
In the Filter Editor, create conditions to target specific data in the dataset. Use multiple expressions and nested Boolean operators to create complex conditions.
-
Right-click a column heading and select Filter Editor.
The Filter Editor dialog displays.
- Edit the condition as required:
- Click a red Boolean operator, such as And, to edit the operator or add a new condition group.
- Click a blue field name, such as [Time Stamp], to change the field to match.
- Click a green operator, such as Equals, to edit the operator.
- Click either <enter a value> or a black value to enter a value.
Click
 to add a new expression to the condition.

- Click Apply to preview the filter.
-
Click OK.
The data is filtered to show only entries that match the criteria entered in the Filter Editor.
- To clear the filtering, right-click a column heading and select Clear Filter.
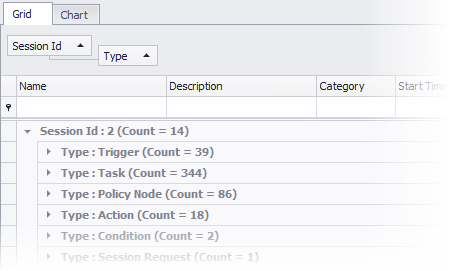
Data can be grouped by one or more columns to create nested datasets. By default, the view is grouped by Username followed by Session Description to create a nested view of users and each user’s sessions.
The username and Session ID are captured at logon. If logging is enabled mid-session, these fields may not be populated.
-
Right-click a column and select Group By Box.
The Group By box displays above the column headings.
-
Drag a column heading into the Group By box. More columns can be dragged into the Group By box to create nested groupings.
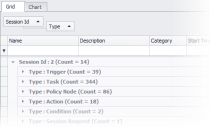
The data is grouped by the fields specified in the Group By box.
- To clear the grouping, right-click on the Group By box and select Clear Grouping.
Individual session logs can be exported and compressed in ZIP format. The log can be emailed to Support if required. Group the log by Username followed by Session Description. For further information, see Group Columns.
- Right-click a session heading and select Export and Compress Session.
- The Browse for Folder dialog displays.
- Select a location to save the exported session log and click OK.
- The session log is exported to the selected location.
- Click inside the grid.
-
Press Ctrl+F.
The Find Panel displays above the column headings.
- Enter a search term.
-
Click Find.
Rows containing text in any column that matches the entered search term are displayed.
- To clear the search, click Clear in the Find Panel or close the Find Panel.
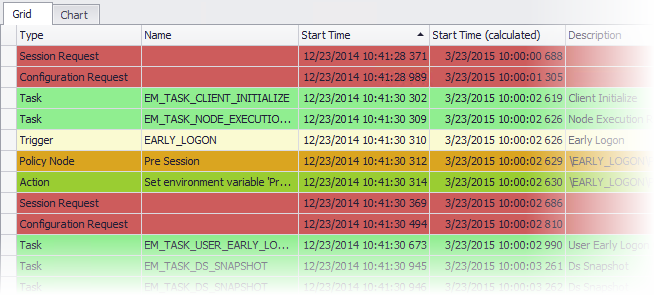
The start date and time of the log can be set to a different date and time. This allows timings of each event to be displayed relative to a specified date and time.
Add the Start Time (calculated) and End Time (calculated) columns to the grid.
For further information about adding columns, see Add Columns.
-
Right-click in the work area and select Update Calculated Times.
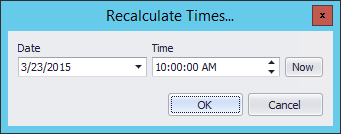
The Recalculate Times dialog displays.
-
Enter a date and time for the start of the log. To specify the current date and time, click Now.
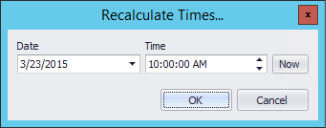
-
Click OK.
The Start Time (calculated) and End Time (calculated) columns update to represent the log start time specified.
Modify default row background colors to uniquely identify event types.
- Right-click a row and select Update Colors.
-
The Update Colors dialog displays.
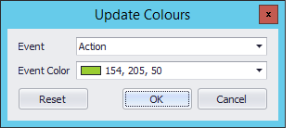
- From the Event field, select the event type.
- From the Event Color field, select a new color for the event. Click More Colors to set a custom color.
- Click OK.
- To revert to the default colors, open the Update Colors dialog and click Reset.
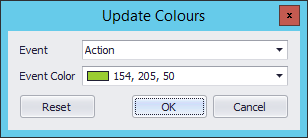
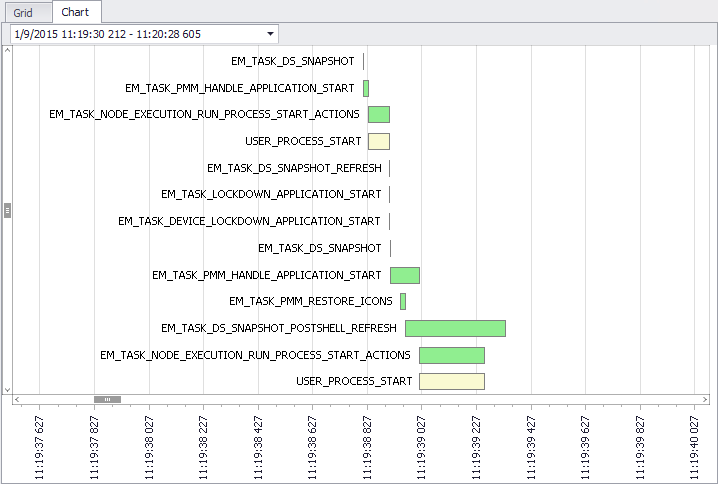
Chart View
The Chart View provides a graphical representation of activity over time. Each bar is an event, such as an action or condition.
The drop-down lists user sessions in the loaded log file. From the drop-down, filter the chart by selecting or deselecting user sessions.
Use the mouse scroll wheel to change the zoom level or press Ctrl+Plus to zoom in and Ctrl+Minus to zoom out. To zoom to a specific chart area, press Shift and draw a rectangle around the required elements. If zoomed in, drag within the chart to pan.
The context menu provides view options, such as bar and axis labels.
To display the bar relating to a specific event from the Grid view, right-click the row and select Show in Chart. To display the row relating to a specific bar from the Chart view, right-click the bar and select Show in Grid.
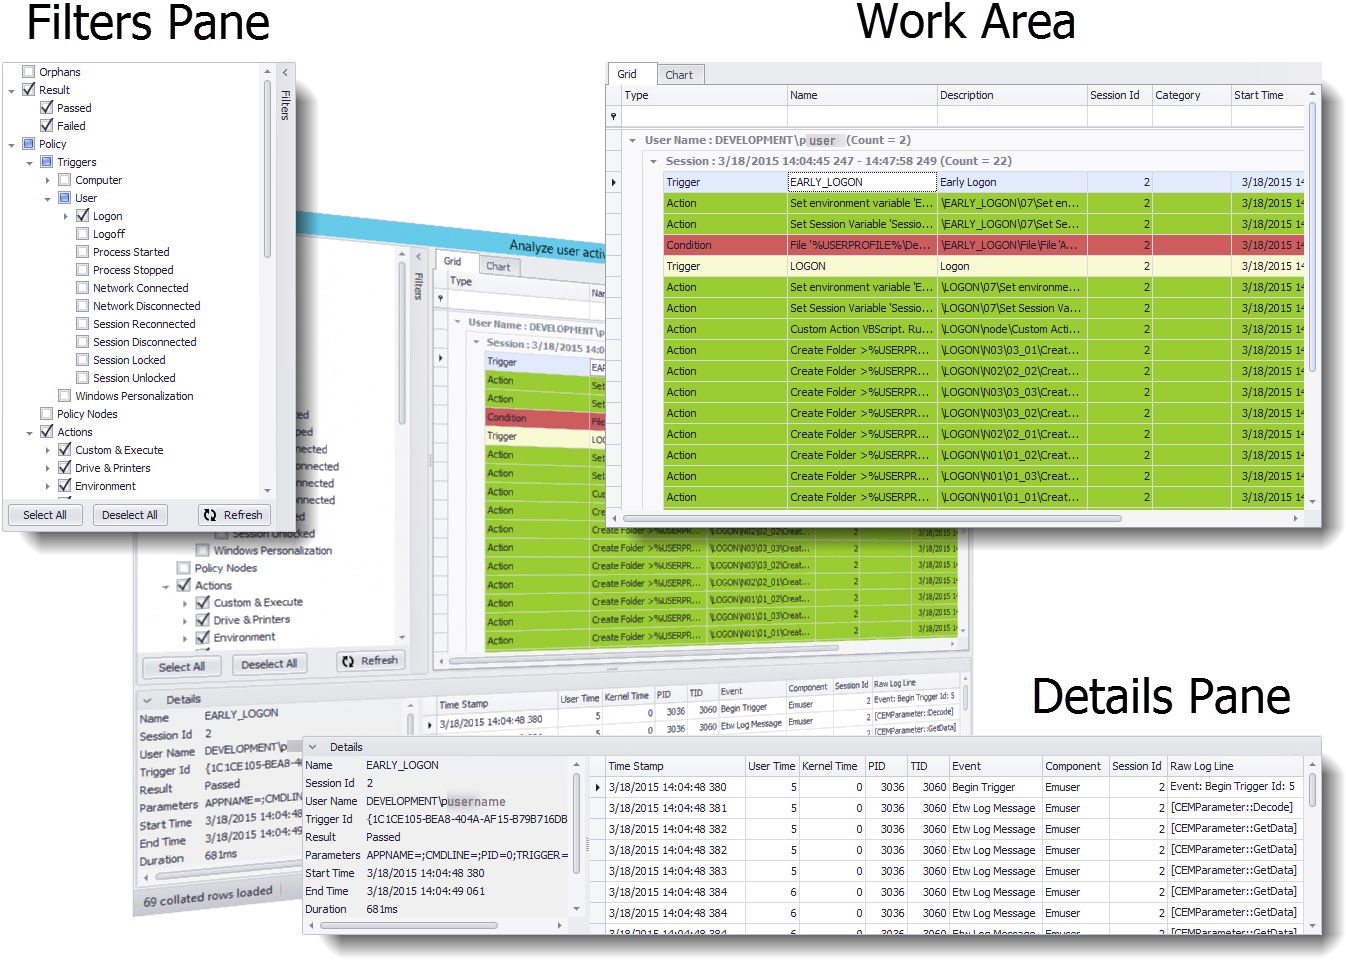
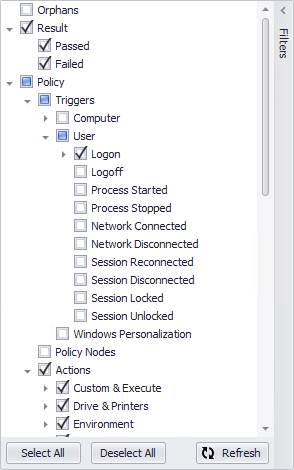
Filters Pane
The Filters pane provides filters that can be applied to the current dataset.
You can apply trigger filters in conjunction with other selected filters. For example, selecting Logon and Actions displays action events in the Logon trigger.
To show events for the Citrix vDisk Client Settings condition, add File & Folder to the filter.
To apply filters:
- Click Filters to expand the Filters pane.
- Select the required filters. Click Select All to select all filters or Deselect All to deselect all filters.
-
Click Refresh.
The filter is applied to the grid or list.
- To clear the filtering, expand the Filters pane, click Select All and click Refresh.
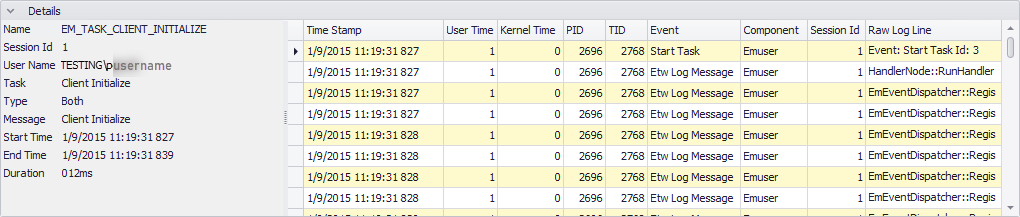
Details Pane
The Details pane provides further information about the selected item in the Grid or Chart view.
The left-hand section shows detailed information about the event, such as error details, duration, user name, user session, and Policy configuration node path. The right-hand section shows the raw log lines for the selected event.
You can sort, filter, group, and search the data in the Details pane just as you can in the work area.
For more information, see Work Area.
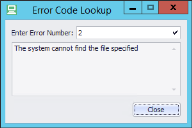
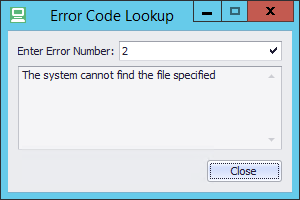
Look Up Error Codes
Look up system error codes from the log file using the built-in tool.
-
Right-click within the work area and select Error Code Lookup.
The Error Code Lookup dialog displays.
- Enter an error code.
-
Click
 .
.The error information displays for the entered error code.